First of all, what does data analysis actually mean? As often, there is no black and white definition of this term but from my point-of-view John W. Tukey, a famous statistician and data analyst, had a good one:
Procedures for analyzing data, techniques for interpreting the results of such procedures, ways of planning the gathering of data to make its analysis easier, more precise or more accurate, and all the machinery and results of (mathematical) statistics which apply to analyzing data.
John W. Tukey
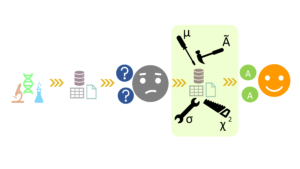
It is not the only “definition” around but it is the definition that I personally share. From this definition it becomes clear that data analysis is not just analyzing data after it was gathered but also includes planning steps such as design of experiments. Nevertheless, let us do one step at a time. The main drive for scientists to do data analysis is (or at least should be) to guide them answering their scientific question. Data analysis is not an end in itself. It rather contains tools that should be applied carefully. After a scientific hypothesis is properly formulated, scientists need to define their target quantities (which help them to prove/disprove the hypothesis) and select the type of experiments / measurement methods. This includes looking carefully at factors which could potentially influence the target quantities. For instance, changing the temperature of a dye solution could influence its fluorescence properties drastically and lead to false results if this temperature dependency would not be taken into account when measuring at varying temperatures. Once the data is gathered, that is where (in practice) a data analysis specialist is consulted. This is often unlucky since he should have been included from the beginning and in supporting the design of experiments. They can for instance estimate the number of trials required to obtain certain confidence. Nevertheless, once the data is gathered, it is wise to start with explorative data analysis, which in simple terms means playing around with the data and get to know it better. The outcome of this playing around are often descriptive measures such as the mean, median, etc. of the dataset. Oftentimes these measures are summarized in one or more appropriate graphs such as scatter plots or box-plots. Sometimes the data is pre-processed (e.g. smoothed for visualizing trends). Finally, the data is described by an appropriate model (that needs to be found) and whose significance needs to be proven. ANOVA or Regression are typical tools of data modelling. Finally, the results need to be interpreted in the light of the original hypothesis. Probably another iteration with different settings might be necessary to come to a final decision/conclusion. Finally, the findings should be reported in a comprehensive way.


