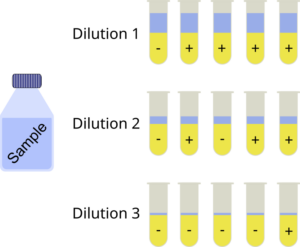
Analyzing drinking water or food for viable bacteria and other microbes is important to prevent epidemic infections. In practice it can be difficult to count the number of viable bacteria directly. It is thus common to set-up a dilution series of the bacterial sample with multiple replicates at each dilution step in dedicated tubes or microplate wells. The actual measurement then reveals whether there was growth in the wells or not. The most probable number (MPN) method is a statistical method to estimate the number of viable cells in the original sample, i.e. it estimates its bacterial density. The assumption of the analysis is that whenever there is one or more bacteria present in a dilution, it exhibits growth. Another assumption is that the bacteria are randomly and homogeneously distributed in the sample (an assumption which might be violated to some extent in practice).
Assume we have a liquid of volume  with (a yet unknown) bacterial density
  and we take a sample of volume
  of this liquid and incubate it in a bacterial growth medium.
  denotes the number of bacteria in the liquid. The probability that our sample does not contain any bacterium (i.e. sterile) is:
![\[p = \left(1-\frac{v}{V} \right)^N\]](https://dataanalysistools.de/wp-content/ql-cache/quicklatex.com-3c41be2a2b9fe3e164ec6b896d39594b_l3.png "Rendered by QuickLaTeX.com")
Compare the calculation of this probability to a problem that is often stated and hated in statistics classes. Rolling a dice times and calculating the probability of not throwing a single 6, given the probability  of throwing a 6 in one dice roll:
![\[p = \left(1-p_6\right)^N\]](https://dataanalysistools.de/wp-content/ql-cache/quicklatex.com-80e80cfdfd6552d8de46ed8b8a28a8ad_l3.png "Rendered by QuickLaTeX.com")
Thus,  in the penultimate equation corresponds to the probability of having a single bacterium in the sample of volume . is typically small compared to and
  can well be approximated by an exponential:
![\[p = \left(1-\frac{v}{V} \right)^N \approx \exp(-v N/V) = \exp(-v \delta)\]](https://dataanalysistools.de/wp-content/ql-cache/quicklatex.com-4c2754ac8235fec20fd226110a07f930_l3.png "Rendered by QuickLaTeX.com")
Let’s now assume we took  samples each of volume . The probability of observing
  sterile and correspondingly
  fertile samples is:
![\[P(s|\delta) = \binom{n}{s} p^s p^{n-s} = \binom{n}{s} \exp(-s v \delta)\left(1-\exp(-v \delta)\right)^{n-s}\]](https://dataanalysistools.de/wp-content/ql-cache/quicklatex.com-52b4c7fef23e92d6340af8a57aca3c37_l3.png "Rendered by QuickLaTeX.com")
This probability  is a function of the bacterial density
  that has a maximum at the most probable number of . We can find by maximizing the log-likelihood of this function (while ignoring the binomial coefficient
  ) which leads us to the following eqaution:
![\[\frac{\left(n-s\right)v\exp(-v\delta)}{1-\exp(-v\delta)} -sv= 0\]](https://dataanalysistools.de/wp-content/ql-cache/quicklatex.com-35b5faed47c95b30807bf9c869326d02_l3.png "Rendered by QuickLaTeX.com")
We’d need to find the root w.r.t. to get our most probable number. In practice, however, a single dilution level with multiple samples (as was assumed above) often results in all tubes being either fertile ( ) or sterile (
 ). This would result in the trivial roots
  and
and  , respectively, being useless. Therefore multiple dilutions with multiple replicates are applied and we come-up with a more general root-equation:
![\[\sum_{k=1}^{D}\left(\frac{\left(n_k-s_k\right)v_k\exp(-v_k\delta)}{1-\exp(-v_k\delta)} -sv_k\right)= 0\]](https://dataanalysistools.de/wp-content/ql-cache/quicklatex.com-7ef98c6459d997c6b563c0e5a96dc734_l3.png "Rendered by QuickLaTeX.com")
where  denotes the number of dilution levels. In practice,
  is quite common but can be bigger of course. The number of replicate tubes often depends on the sample format and whether they are measured in test tubes or microplates. In the latter case 8 replicates per dilution level are commonly used as 96 well plates (8 rows, 12 columns) is an often used plate format.
Below you can find an Excel LAMBDA function that calculates the most probable number (MPN) based on the input of an array for the number of replicates per dilution level, an array for the number of sterile replicates and an array for the volumes of the original sample in the corresponding dilution (in ml). You can optionally set the stats-variable to TRUE to also get the confidence intervals for the MPN.
=LAMBDA(n,s,v,[d0],[stats], LET(
url,"https://dataanalysistools.de",
d0,IF(ISOMITTED(d0),1,d0),
stats, IF(ISOMITTED(stats),FALSE,stats),
iter, SEQUENCE(200),
result, REDUCE(d0, iter, LAMBDA(acc,value, acc + (SUM((n-s)*v/(EXP(v*acc)-1))-SUM(s*v))/(SUM(n*v^2/(EXP(v*acc)-1))))),
fisher, SUM(n*v^2/(EXP(v*result)-1)),
cilow, result/EXP(1.96/(SQRT(fisher)*result)),
cihigh, result*EXP(1.96/(SQRT(fisher)*result)),
IF(stats,HSTACK(result,cilow,cihigh),result)))
Open the Name Manager under Formulas in Excel, create a new variable/formula that you name MPN and copy the code into the text field next to Refers to:. Then you can use this formula in Excel. Please note that LAMBDA-functions can only be created in Office 365.
The data obtained in these dilution assays is closely related to data obtained with quantal dose-response assays (see https://dataanalysistools.de/2023/09/21/analysis-of-bioassays/) and are sometimes also analyzed by using the Spearman-Kärber method, a non-parametric method to analyyze quantal response data (see https://dataanalysistools.de/2020/05/05/spearman-kaerber-analysis-and-the-creutzfeld-jakob-disease/).