The advent of digital technology has given rise to an exponential increase in novel measurement techniques thereby producing more data than ever before. Data is key for any experimental or theoretical project in science. It was towards the end of my PhD, I encountered serious technical challenges in data interpretation and representation of the complex spectroscopic data I had obtained during the course of my doctoral research. I was handling single molecule data, which made statistical analyses all the more relevant. This motivated me to dig deeper and wrestle with computational statistics for an improved analysis.
Scientific projects are more often than not based on empirical research. This makes data all the more crucial for the outcome of the project. Hence, data analysis is now a part of almost every research project in Natural Sciences and Engineering. In life sciences, technologies like Next Generation Sequencing and Microarrays have already revolutionized and proven how important data integration and interpretation is in “high-throughput” quantification.
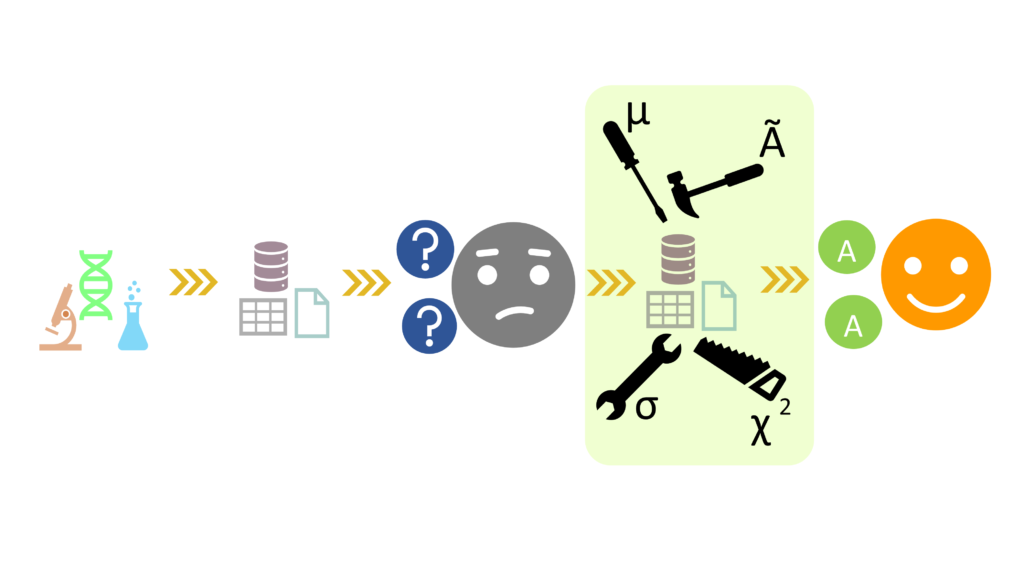
Conventionally, life scientists are introduced to statistical modules as a theory from mathematics text books followed by practical problems. But more recently, focus has shifted to directly starting with a real or simulated data related problem in a computer and toying around with different tools. The basic stages of a scientific experiment normally are planning, designing, acquiring data, organizing, analyzing, interpreting and presenting data. Hence, in a “data-driven” scientific research, comprehensive data analysis tools and statistical algorithms are crucial. Though largely the choice and use of such tools depend on the type of experiments and requirements of the analysis, however following are the basic statistical tools used in data analysis in Natural Sciences:
- Descriptive statistical tools – quantitatively summarize the data based on observations of their properties. There are four main types of descriptive tools as measures of:
- Central tendency: Gives a comprehensive summery of whole data set by giving centre point of the distribution. The most widely used measures are mean, median and mode.
- Frequency: Normally used to quantify how often a response or an incident occurs. Percent, frequency are most commonly used measures of frequency.
- Dispersion: Used to study variability of the items in the data sets, both among the items and around the average. Standard deviation, mean deviation, range, variance etc. are some of the measures of dispersion or variation.
- Inferential statistical tools- This involves taking a random sample from a population to analyse and draw inference about the whole population from this. Two main methods used in inferential statistics are:
- Estimation: Here, a statistical measure is taken from the sample data to estimate something about a population parameter.
- Hypothesis: This is more commonly used in scientific research. More commonly, here a “null hypothesis” is put forward and it is analysed if the recorded data are strong enough of nullify the hypothesis. E.g. Chi square tests.
- Correlation and Regression: Correlation and linear regression are used to determine relation between two measurement variables. Correlation quantitatively measures the degree and direction to which the variables are associated whereas linear regression models and gives the best fitted line that predicts dependent variable from independent variable. The measure of strength of association (r2) is calculated by linear regression.
- Analysis of Variance (ANOVA): This is very popular in scientific research to find the significance of an experiment or a study. ANOVA checks the influence of one or more experimental parameters by comparing the means of different sample. It helps prove or disprove a hypothesis. Depending on the number of independent variables in the particular test, ANOVA test is classified into:
- One-way ANOVA test: This is a hypothesis based used to determine whether there are any statistically significant differences between the means of three or more independent (categorically isolated) groups. It has only one independent variable, hence the name.
- Two-way ANOVA test: This is an extension of the one way ANOVA and determines the influence of two different categorically independent variables (called factors) on one continuous dependent variable.
- Multi-way ANOVA test: Similar to the above two types of ANOVA tests, this estimates the interaction effect between more than two categorically independent variables. This is further extension of ANOVA test depending on variables and can go upto n number of variables.
- Survival Analysis: This is more significant in medical research to study effects of particular drugs and treatment. Here, the disease, drug or diagnostics are not of primary interest, rather, the time lapsed due to the event is of utmost importance. The events are usually deleterious in nature. One of the most common software used for survival analysis statistic is SPSS – Statistical Package for the Social Sciences.
These are the basic statistical analysis tools for data sets of any studies. Other popular tools like t-tests, linear models, partial least square analysis (PLSA) and many more have important application in data analysis. A rich and intuitive statistical toolbox is necessary for more advanced analysis. We will discuss these and various other tools individually in upcoming blogs.
Due to the unprecedented emergence of data science, many statistical softwares are also at our disposal now. Some of the most commonly used statistical softwares are:
- SAS (Statistical Analysis System – developed by SAS Institute North Carolina, United States of America)
- R (designed by Ross Ihaka and Robert Gentleman from R core team)
- SPSS (Statistical Package for the Social Sciences – manufactured by IBM corporation
- Stata (developed by StataCorp), Prism (developed by GraphPad Inc. California) and
- MS Excel (developed by Microsoft)
Apart from these, there are several contents available in the web like G-Power, Prism etc. which are found to be quite resourceful for statistical power analysis.
This is important to wisely choose the most suitable tool depending on the field of study and analysis. For example, simple data sets and smaller sample size having two columns or so, running a student t-test in excel would normally be sufficient. For a more complex data, analysis with R is more effective. But as of now, majority of the life scientists and medical practitioners aren’t well versed in it due to the complexity of the software. And many experiments also require tools which are in between excel and R or Python. Hence, custom programs are increasingly getting popular due to their dynamic nature to efficiently cater to the unique requirements of particular projects. It would depend on us how well we can integrate the algorithms, models and methods into the data analysis environment.